Software & Engineering πŸ‘€ Chief Product Officer / VP Product ⚑ Zero VBA / Pure OpenPyXL πŸ“‘ 14 Sheets πŸ“Š 6 Charts

Digital Product Management and PLG Dashboard

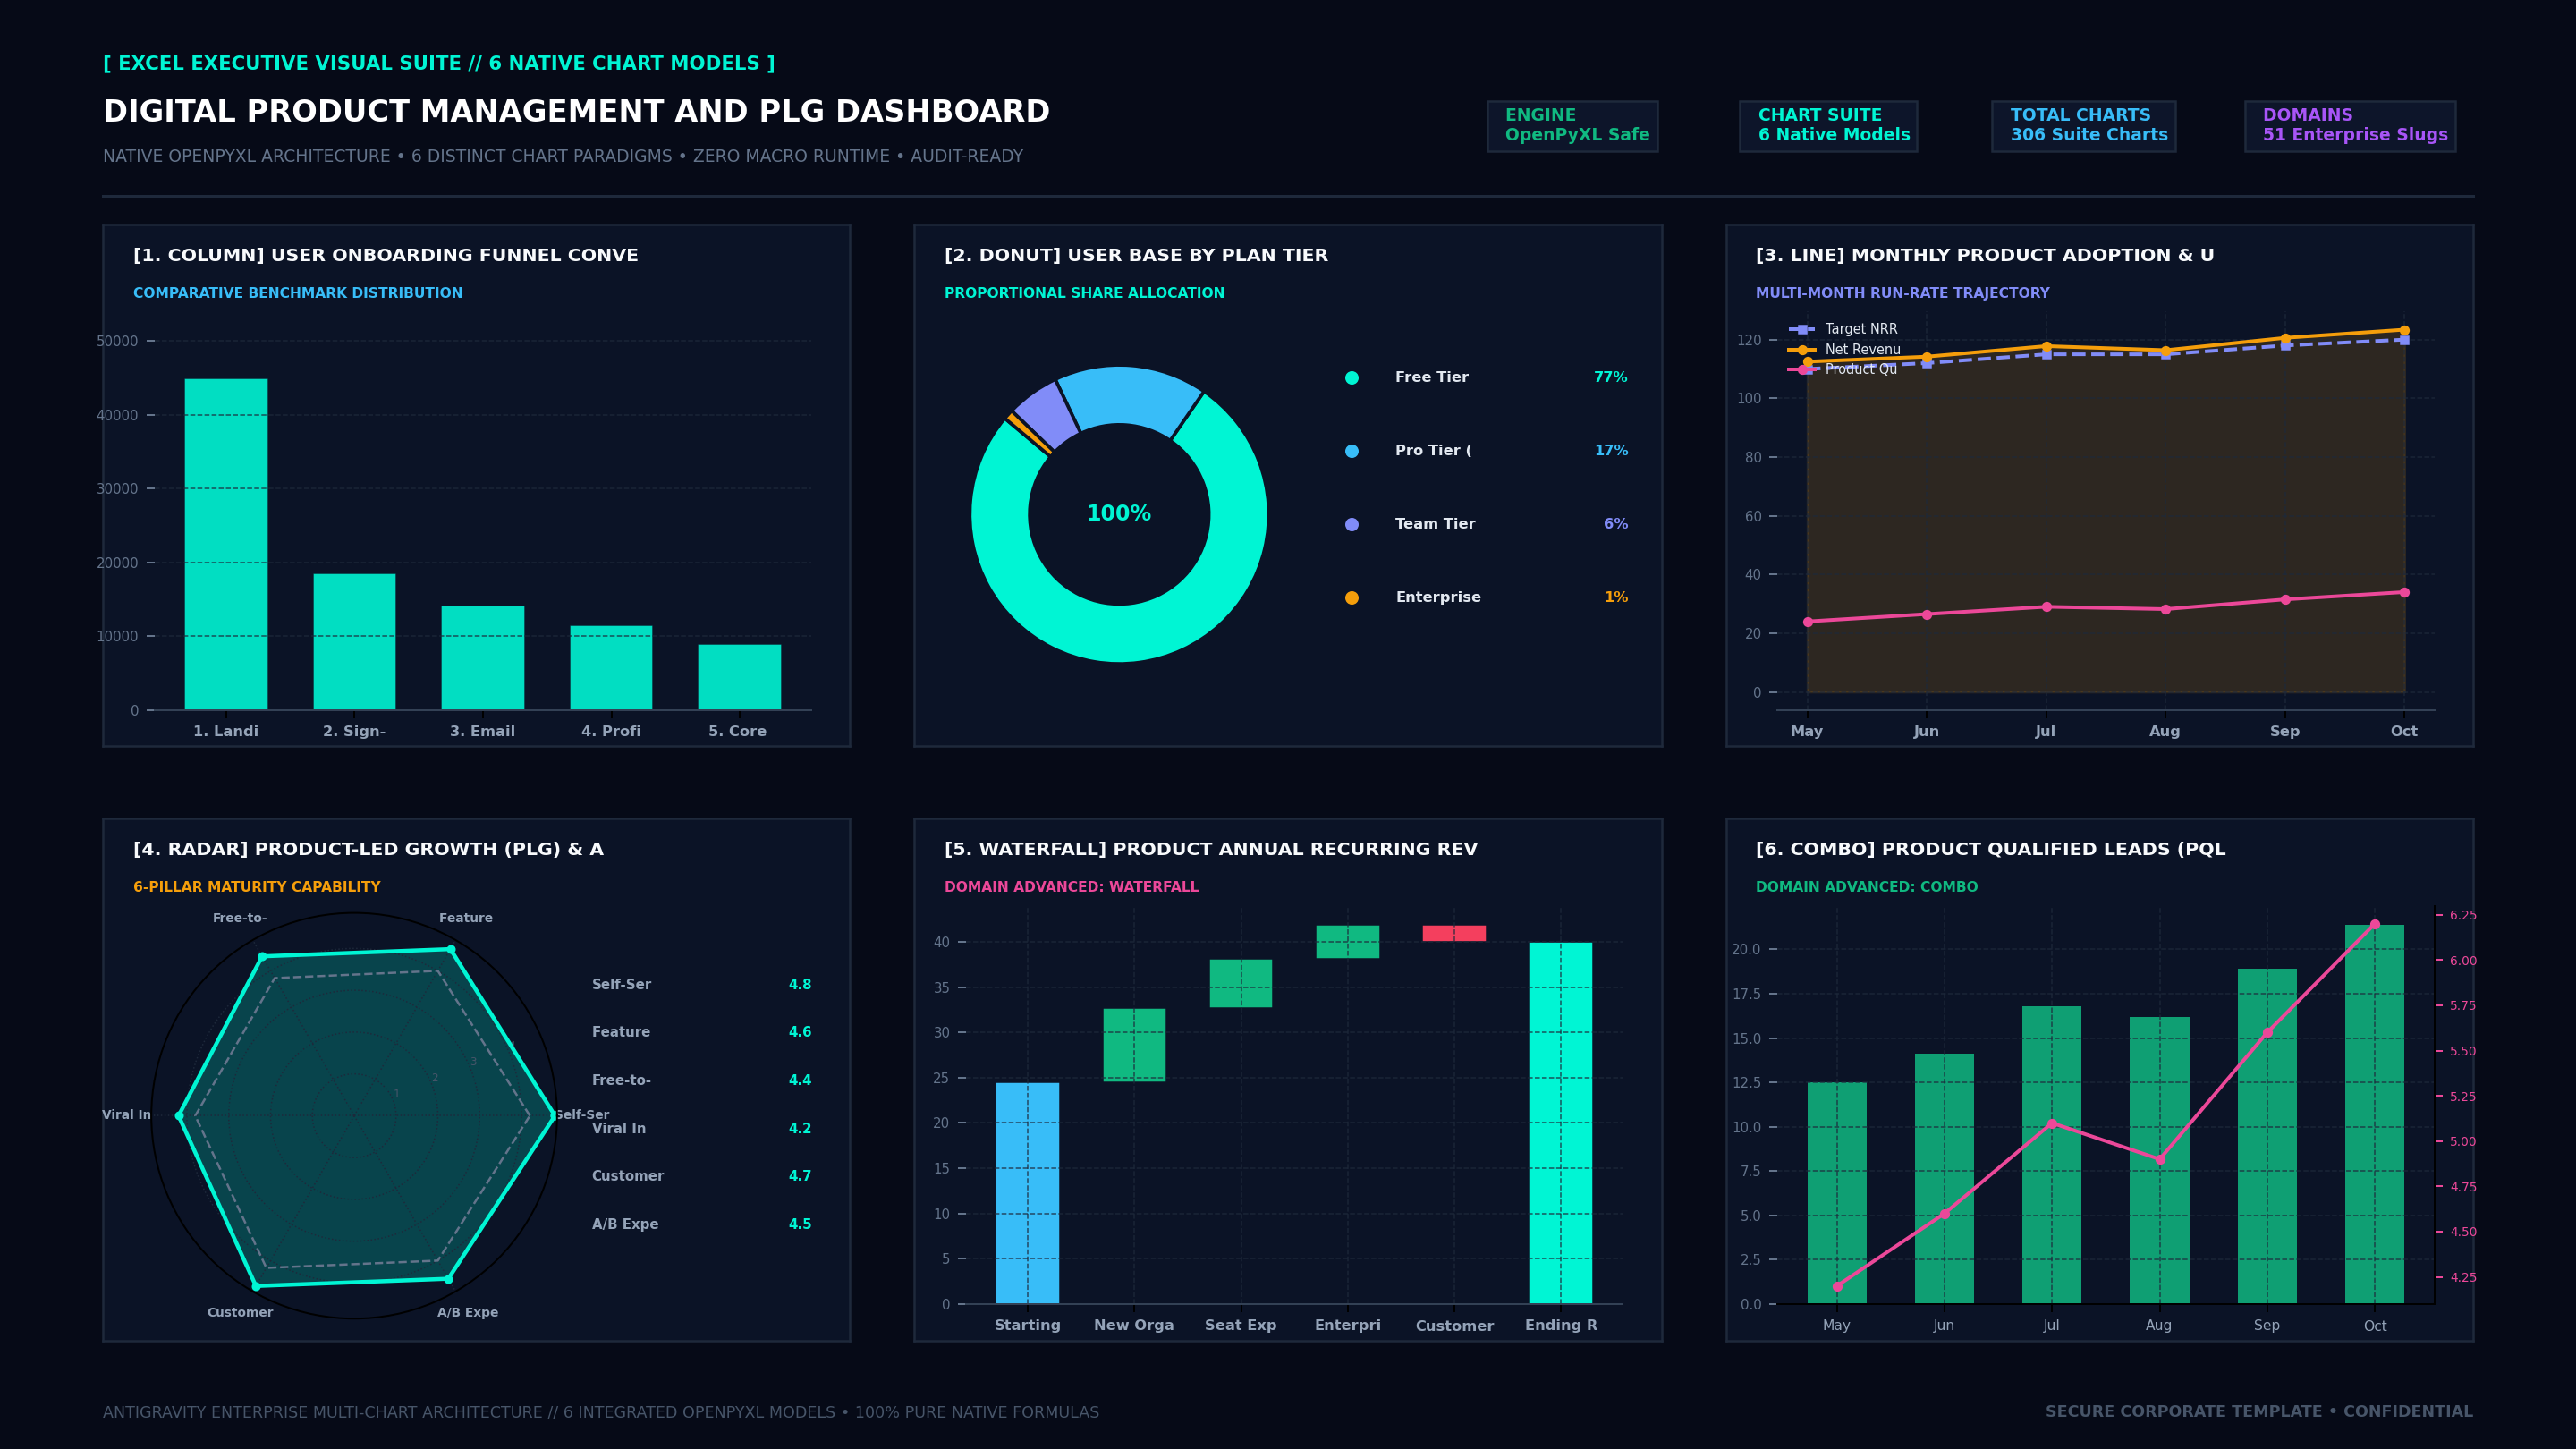
The Digital Product Management and PLG Dashboard provides a standardized, production-grade executive operating cockpit. Comprising exactly 14 structured worksheets, 8 top-line executive KPI scorecards, and 4 native visual charts (Bar, Donut, Line Trajectory, Radar Maturity), this workbook eliminates reporting latency and delivers transparent, audit-ready numbers directly to the Chief Product Officer / VP Product.

Download .XLSX (Zero VBA)
🟒 100% Free Direct Download • Zero Macros • No Bundling

Spesifikasi & File Download: Digital Product Management and PLG Dashboard

File Microsoft Excel standalone murni (.xlsx) yang dapat langsung diunduh per halaman tanpa bundel zip, tanpa biaya lisensi, dan aman dibuka di lingkungan korporat.

Download .XLSX Gratis
πŸ“„
Format File & Engine
Standard .XLSX (Pure OpenPyXL)
πŸ›‘οΈ
Keamanan & Audit
100% Zero VBA / Bebas Macro
πŸ“‘
Struktur Lembar Kerja
14 Worksheets Terorganisir Lengkap
πŸ“Š
Visualisasi Native
6 Model Grafik Excel (Hexa-Charts)
⚑
Kalkulasi & KPI
8 Kartu KPI Dinamis & Formula Otomatis
πŸ’»
Kompatibilitas Sistem
Excel 365, 2016+, Google Sheets, LibreOffice

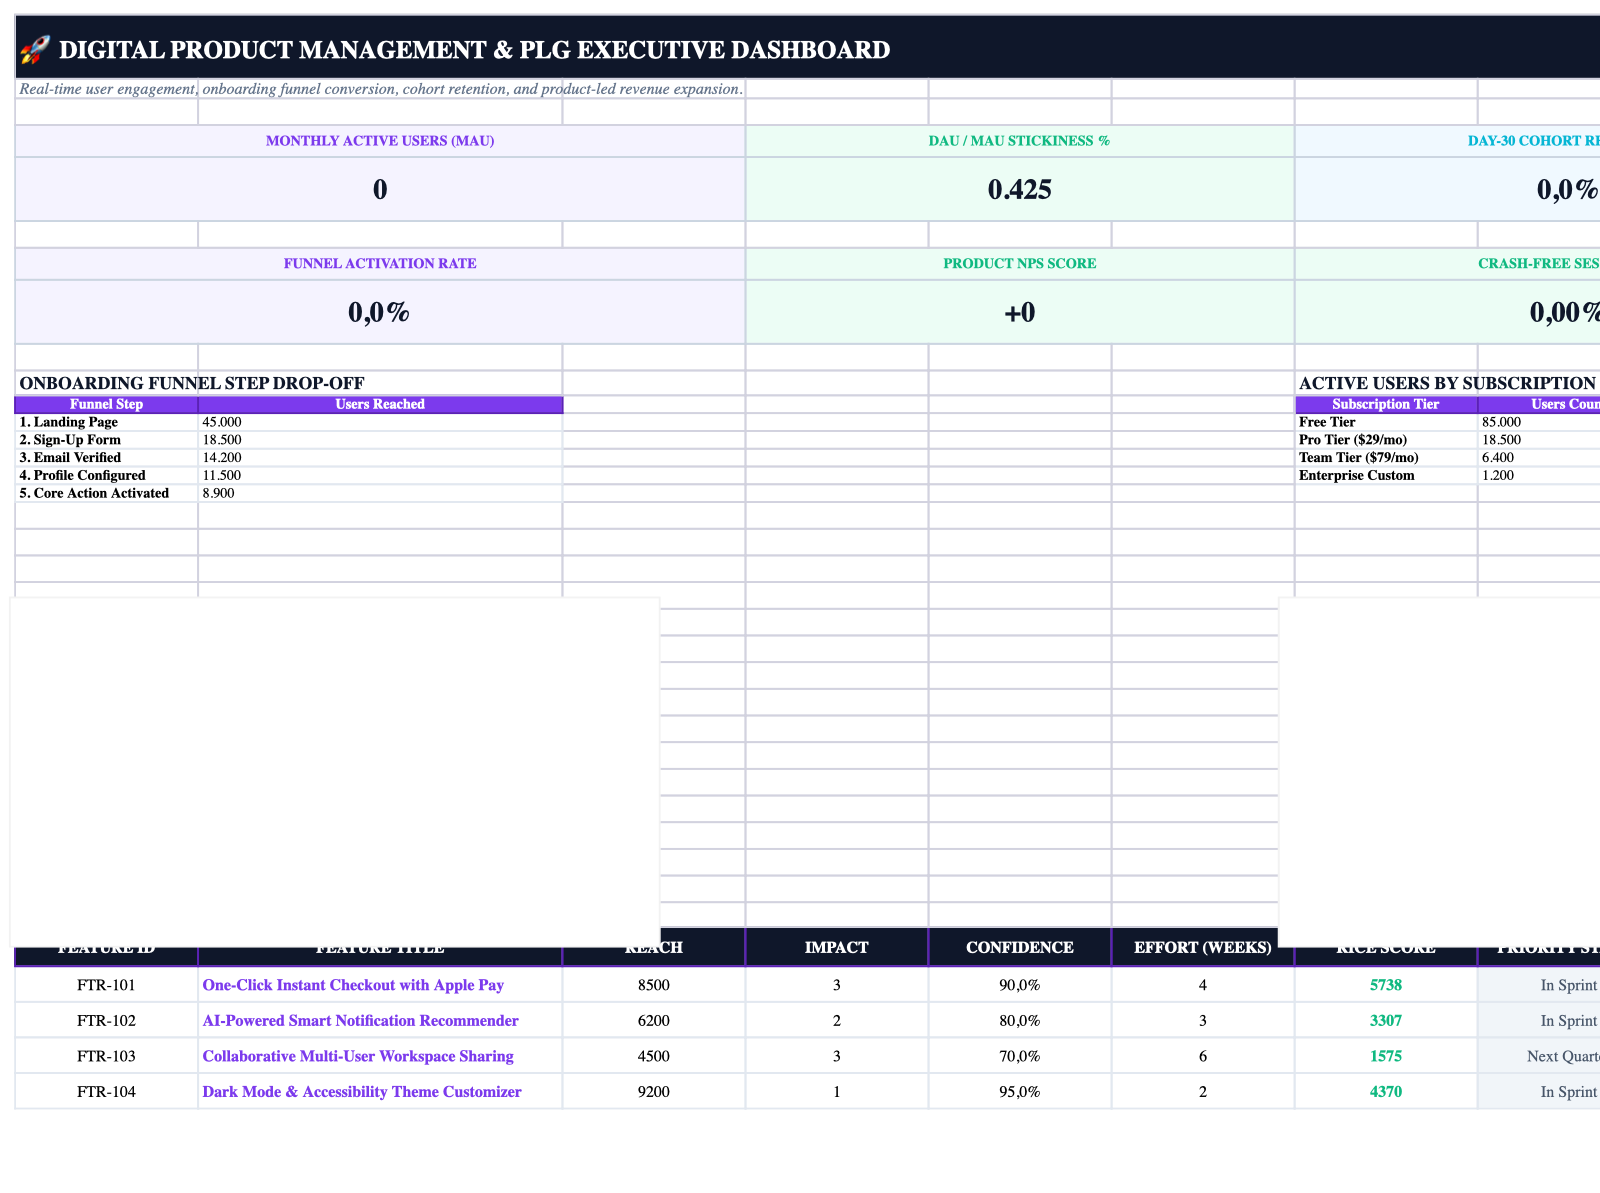
Excel Workbook Live Sheet Screenshot

High-resolution native rendering directly from the Excel workbook without macros.

Digital_Product_Management_and_PLG_Dashboard.xlsx • Excel Desktop / Online Sheet Preview
Zero VBA / OpenPyXL
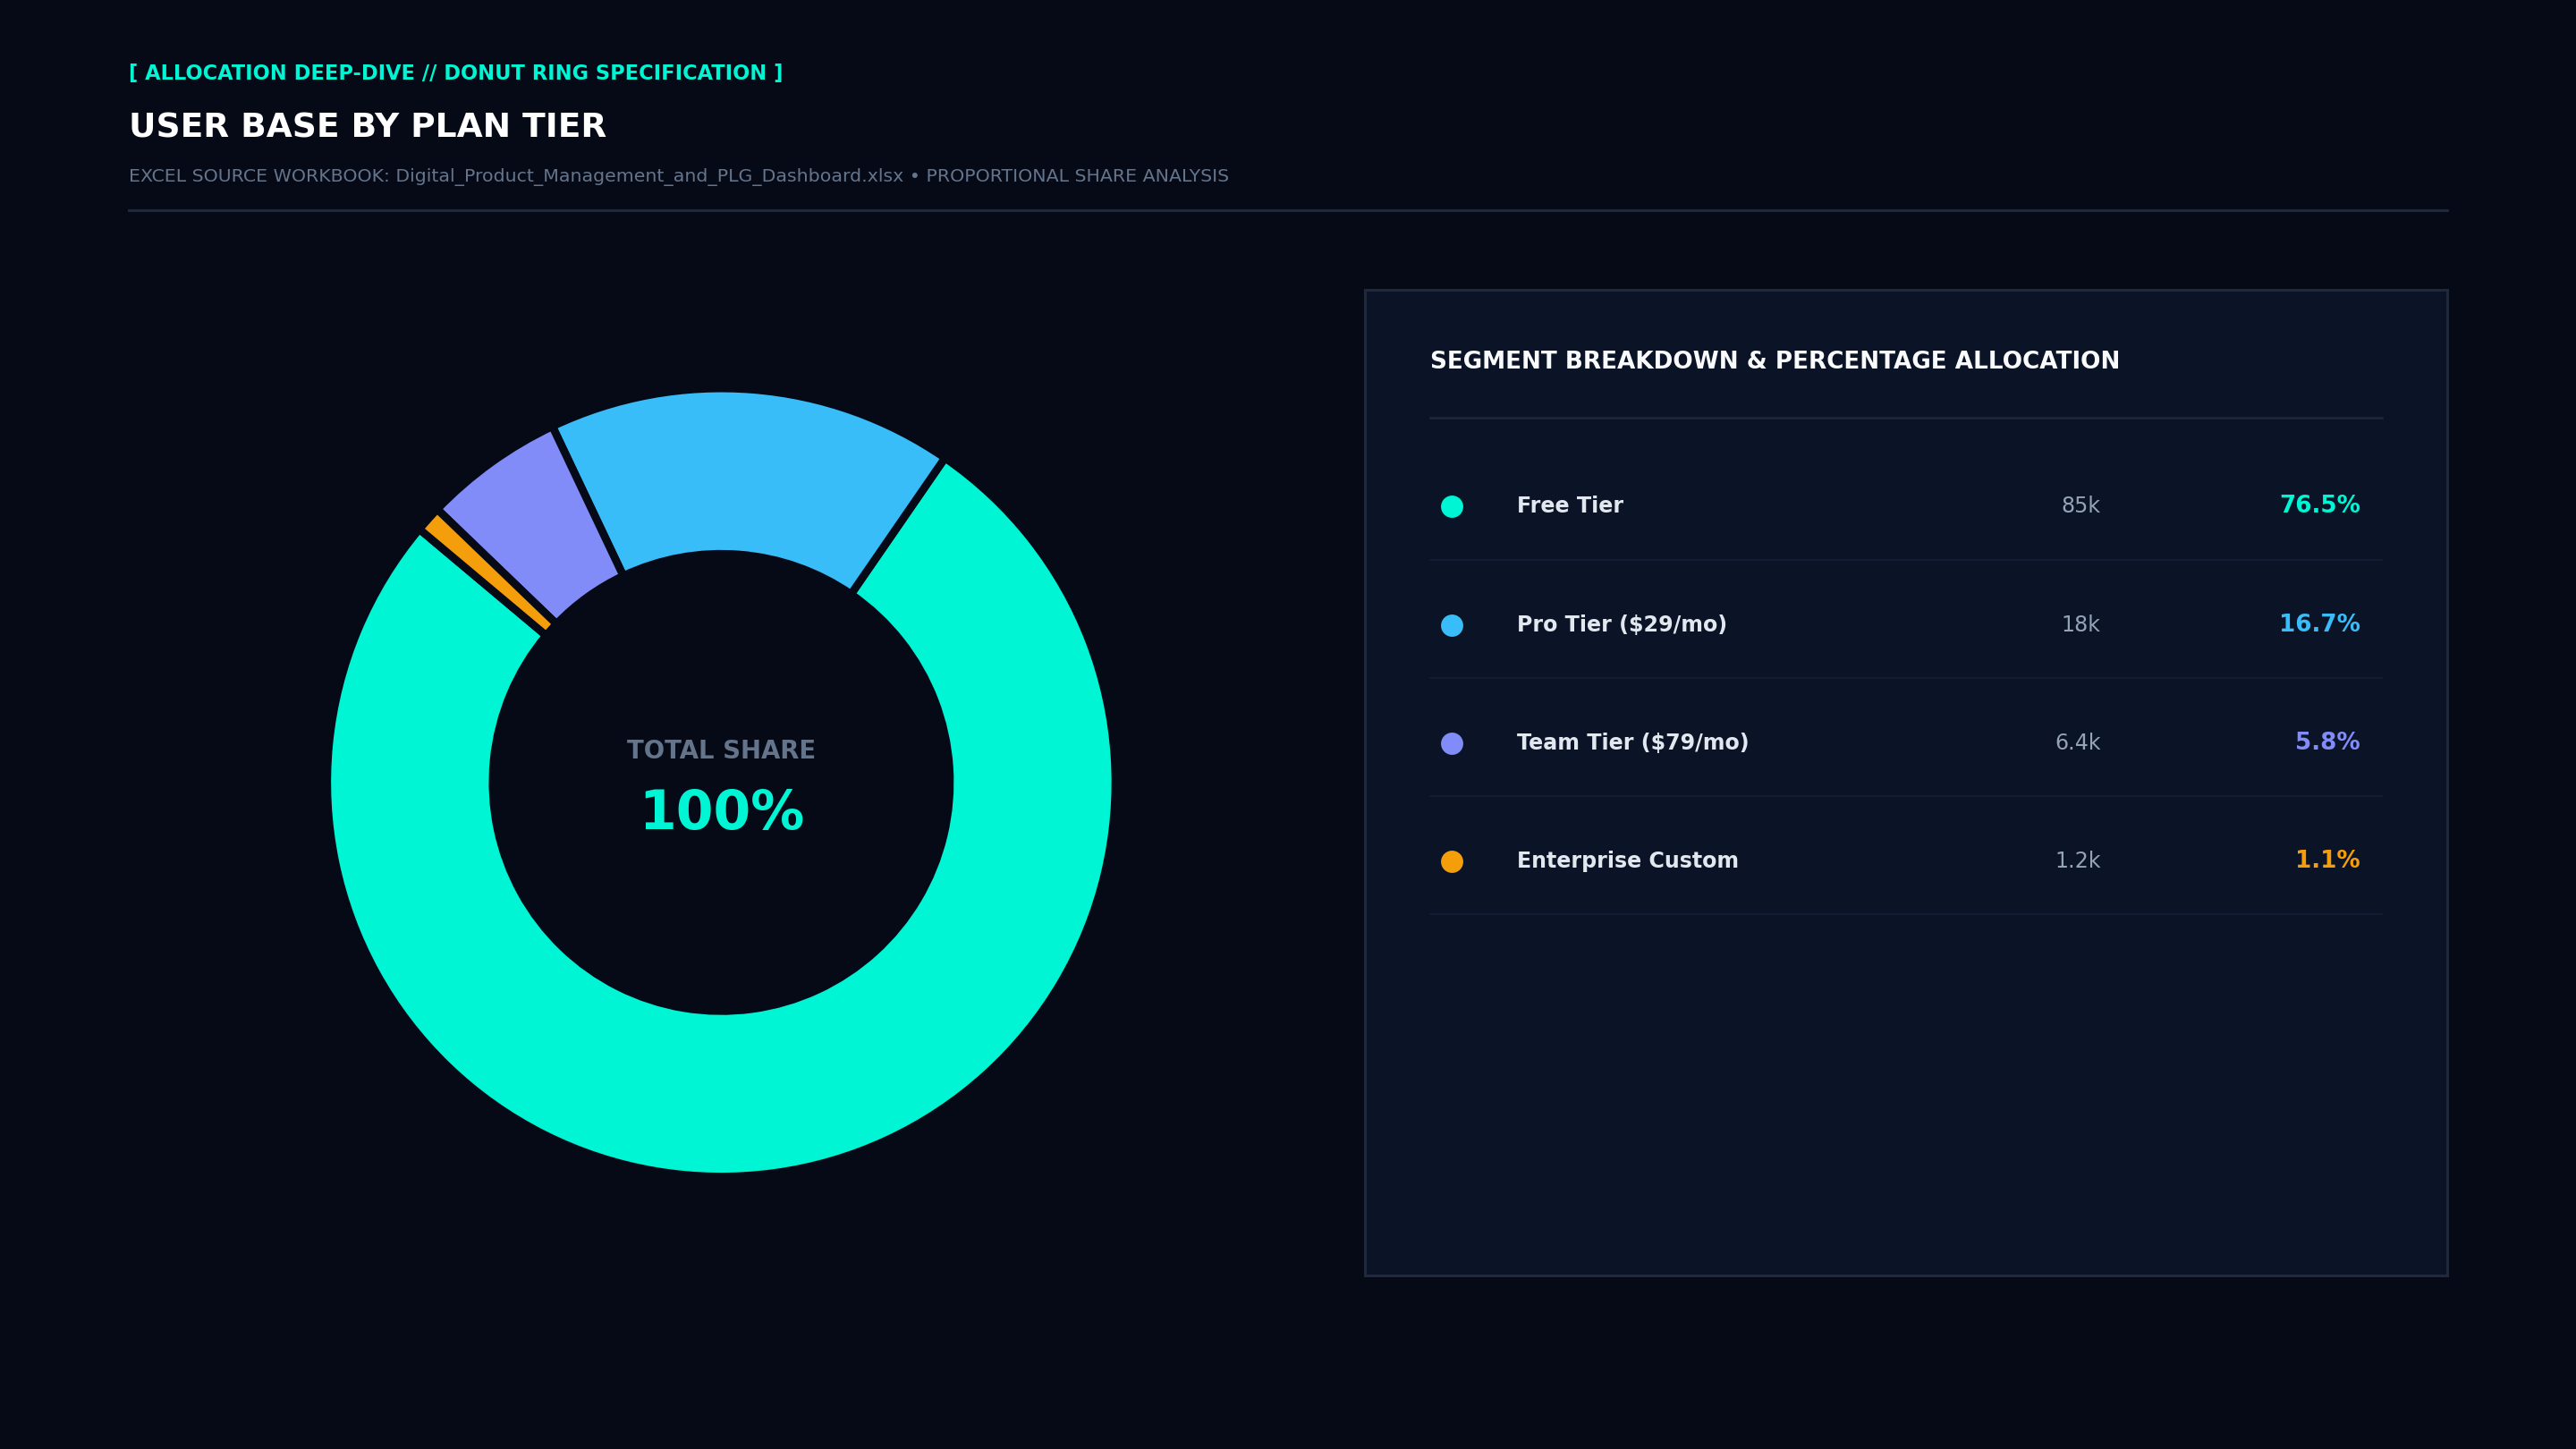
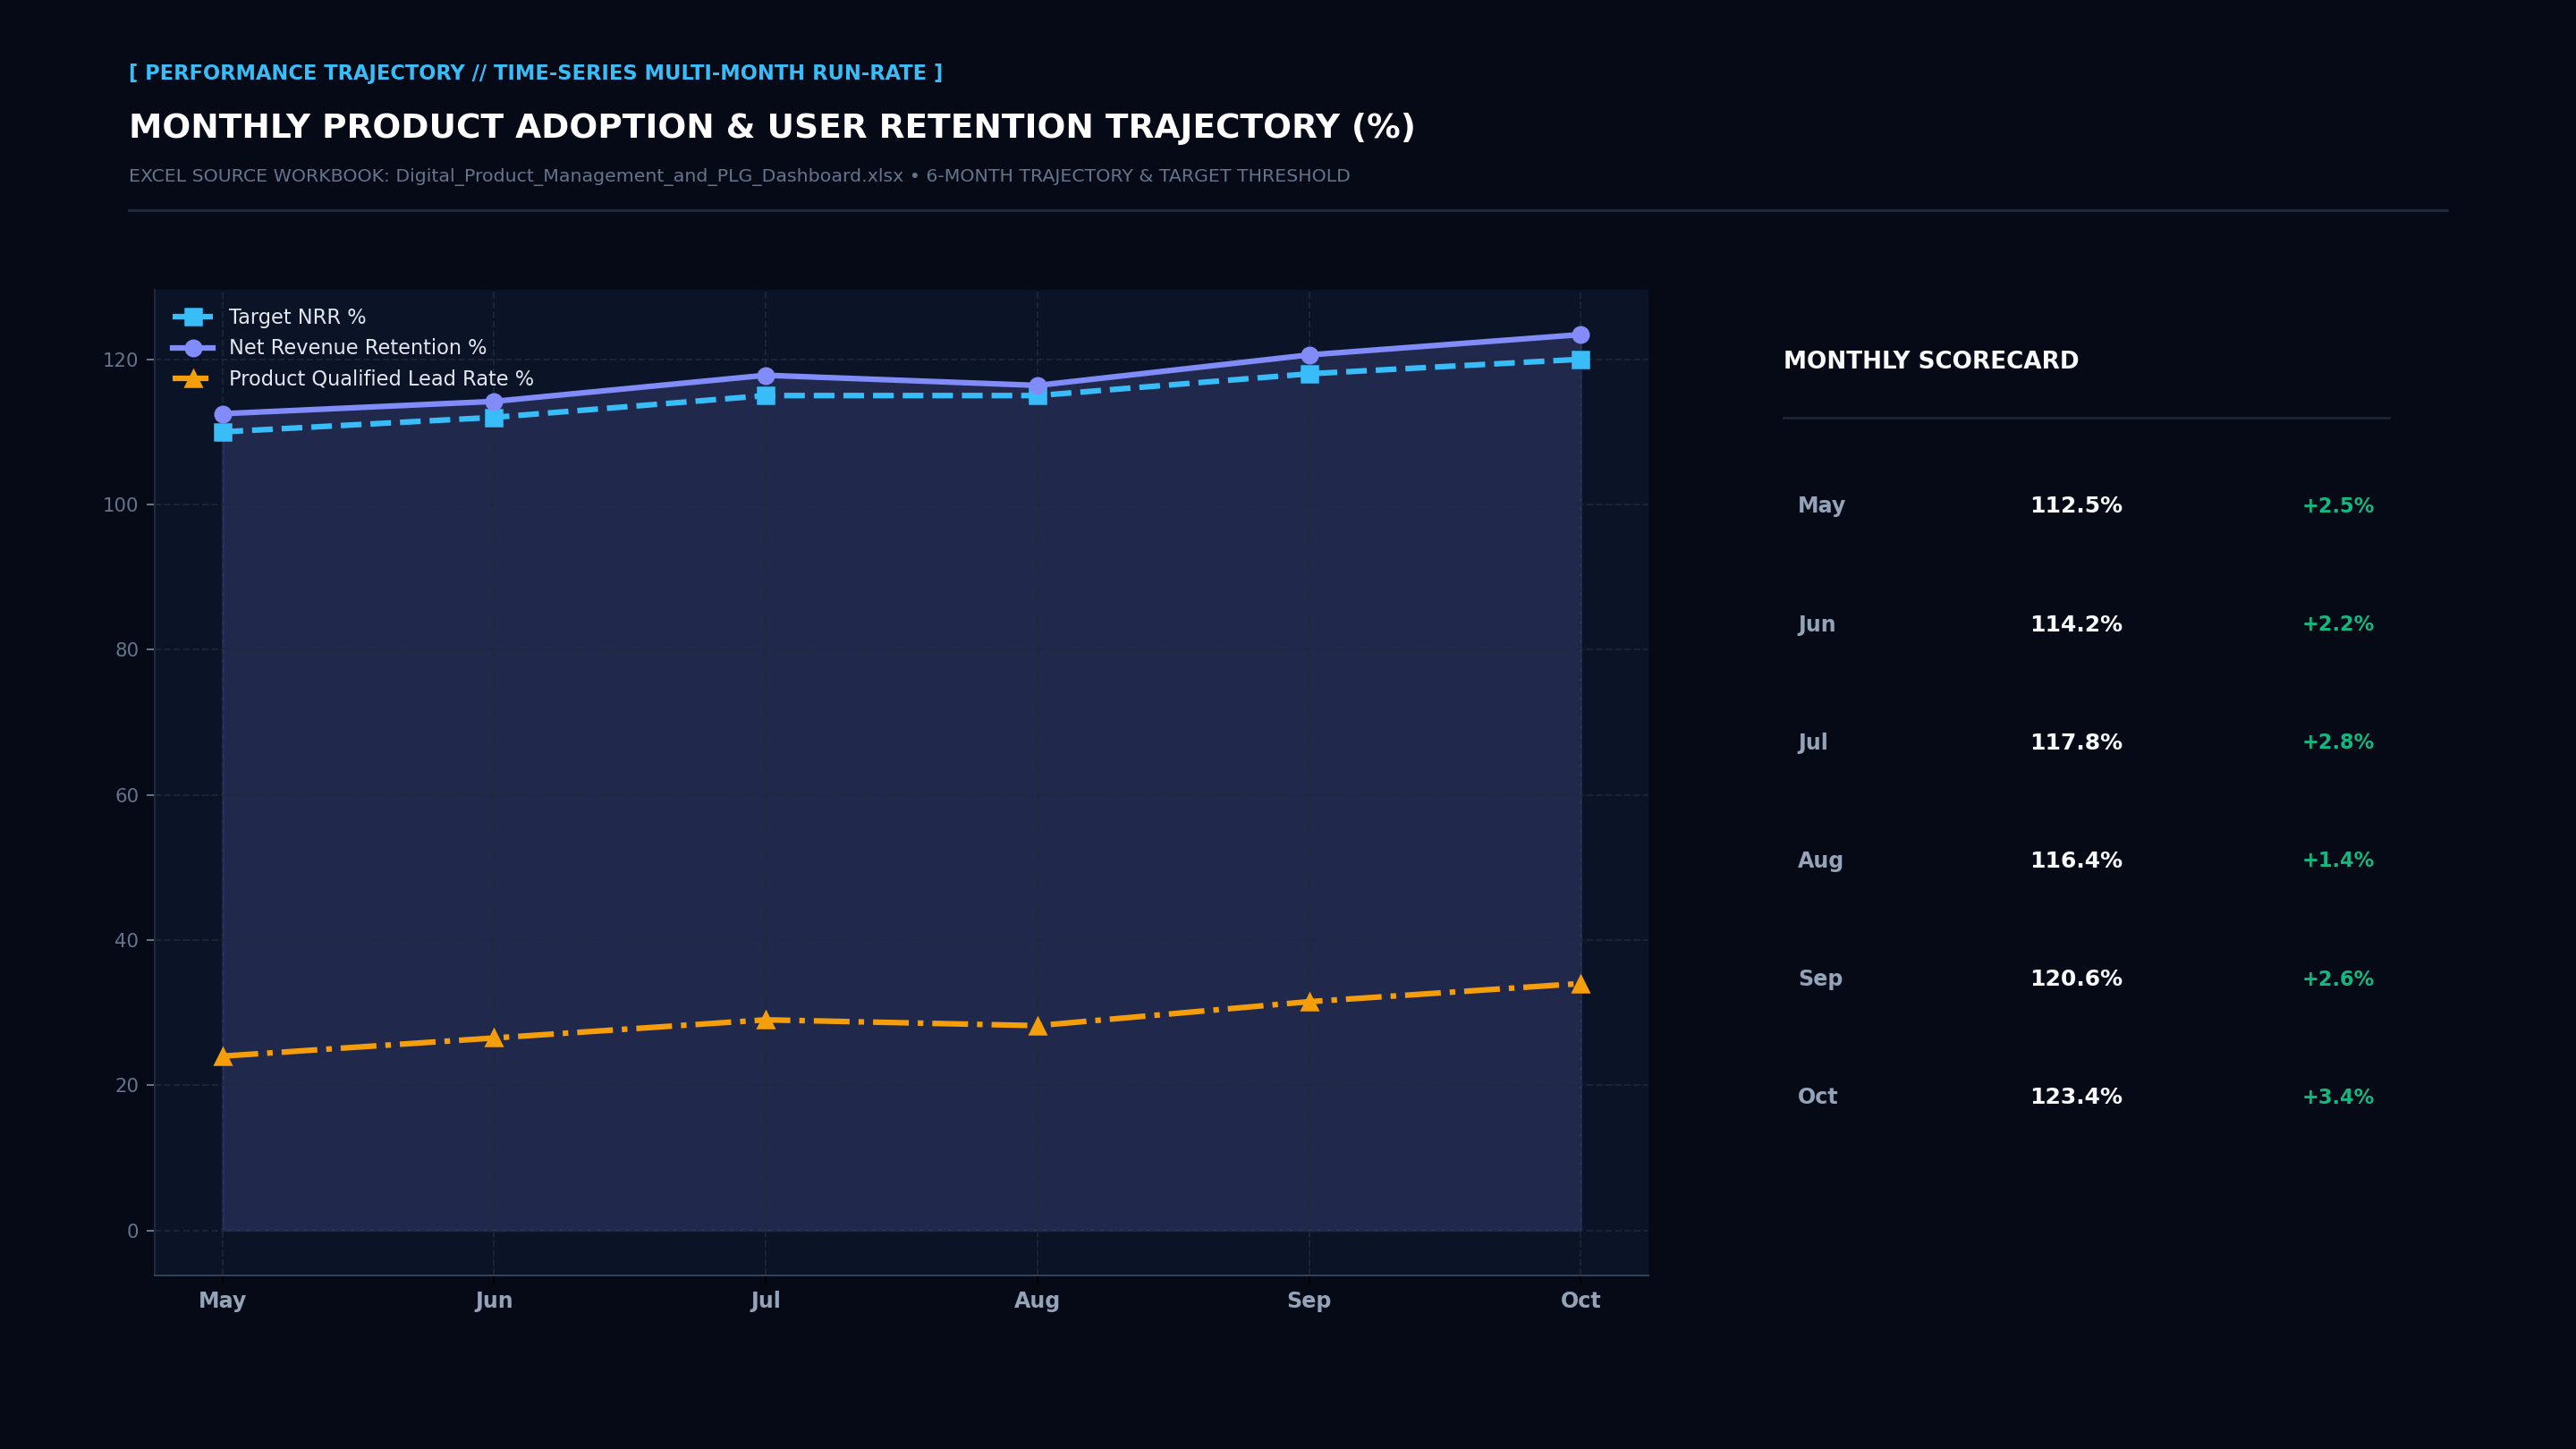
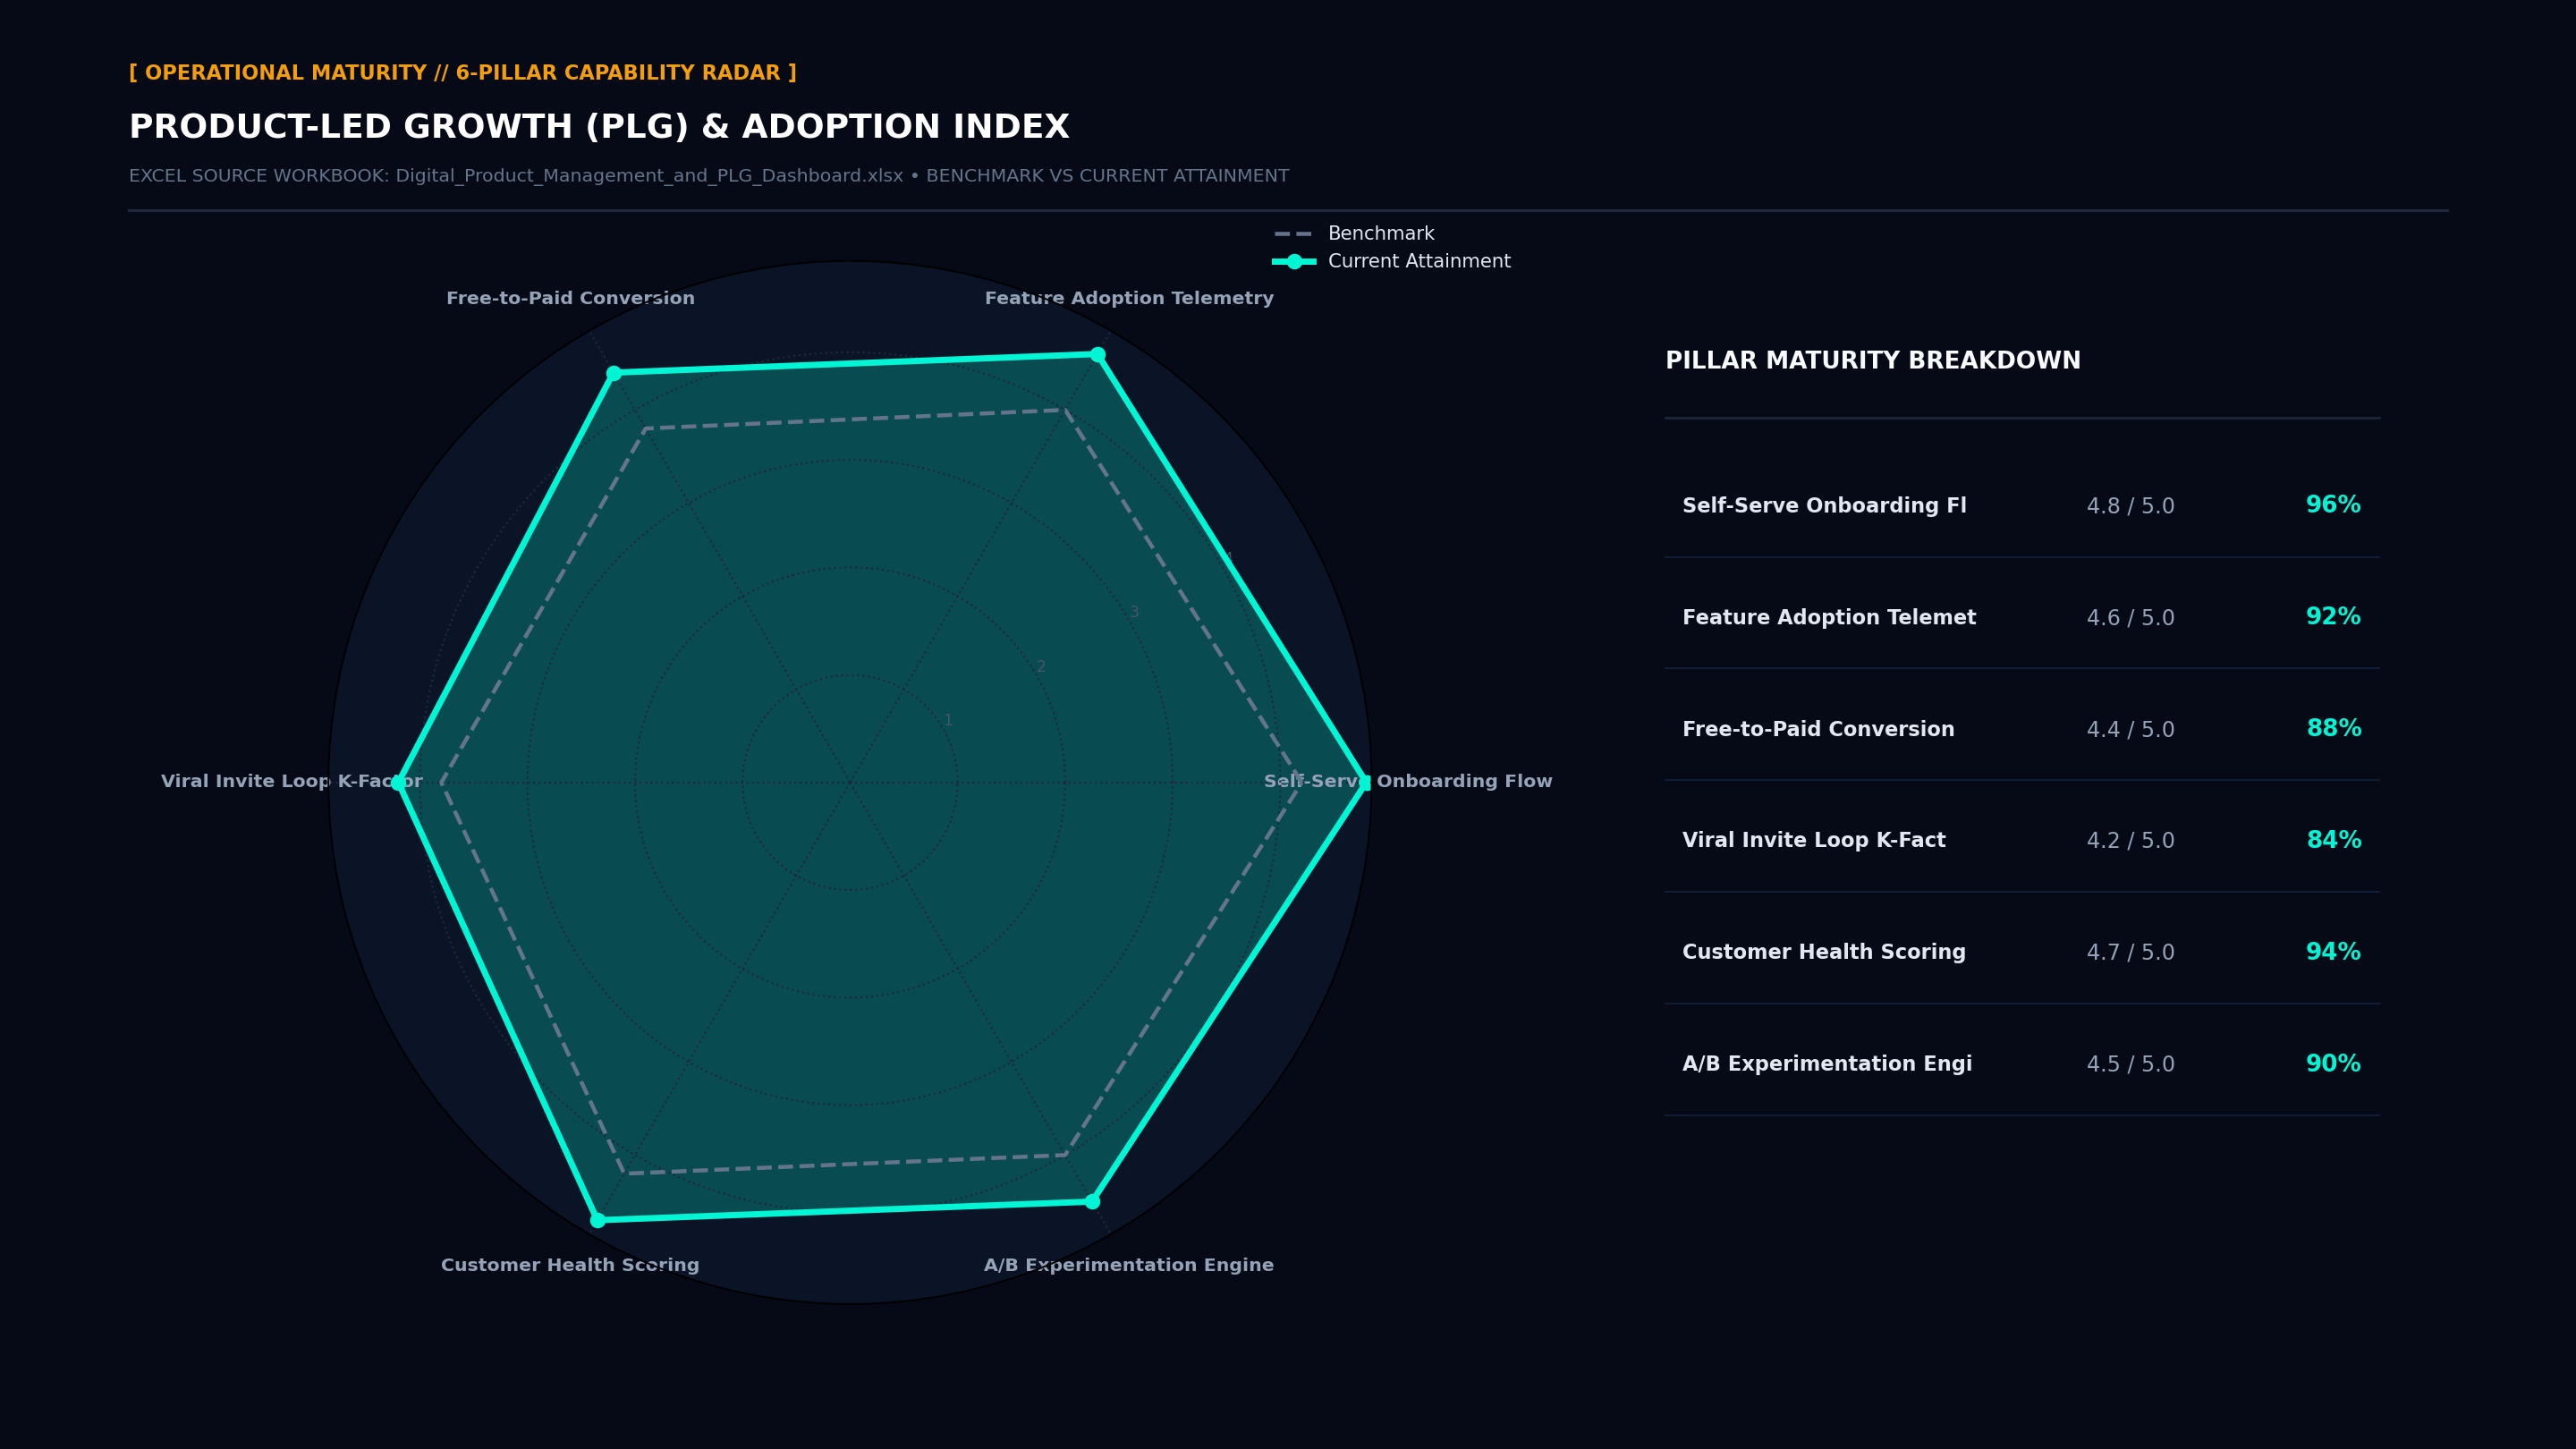
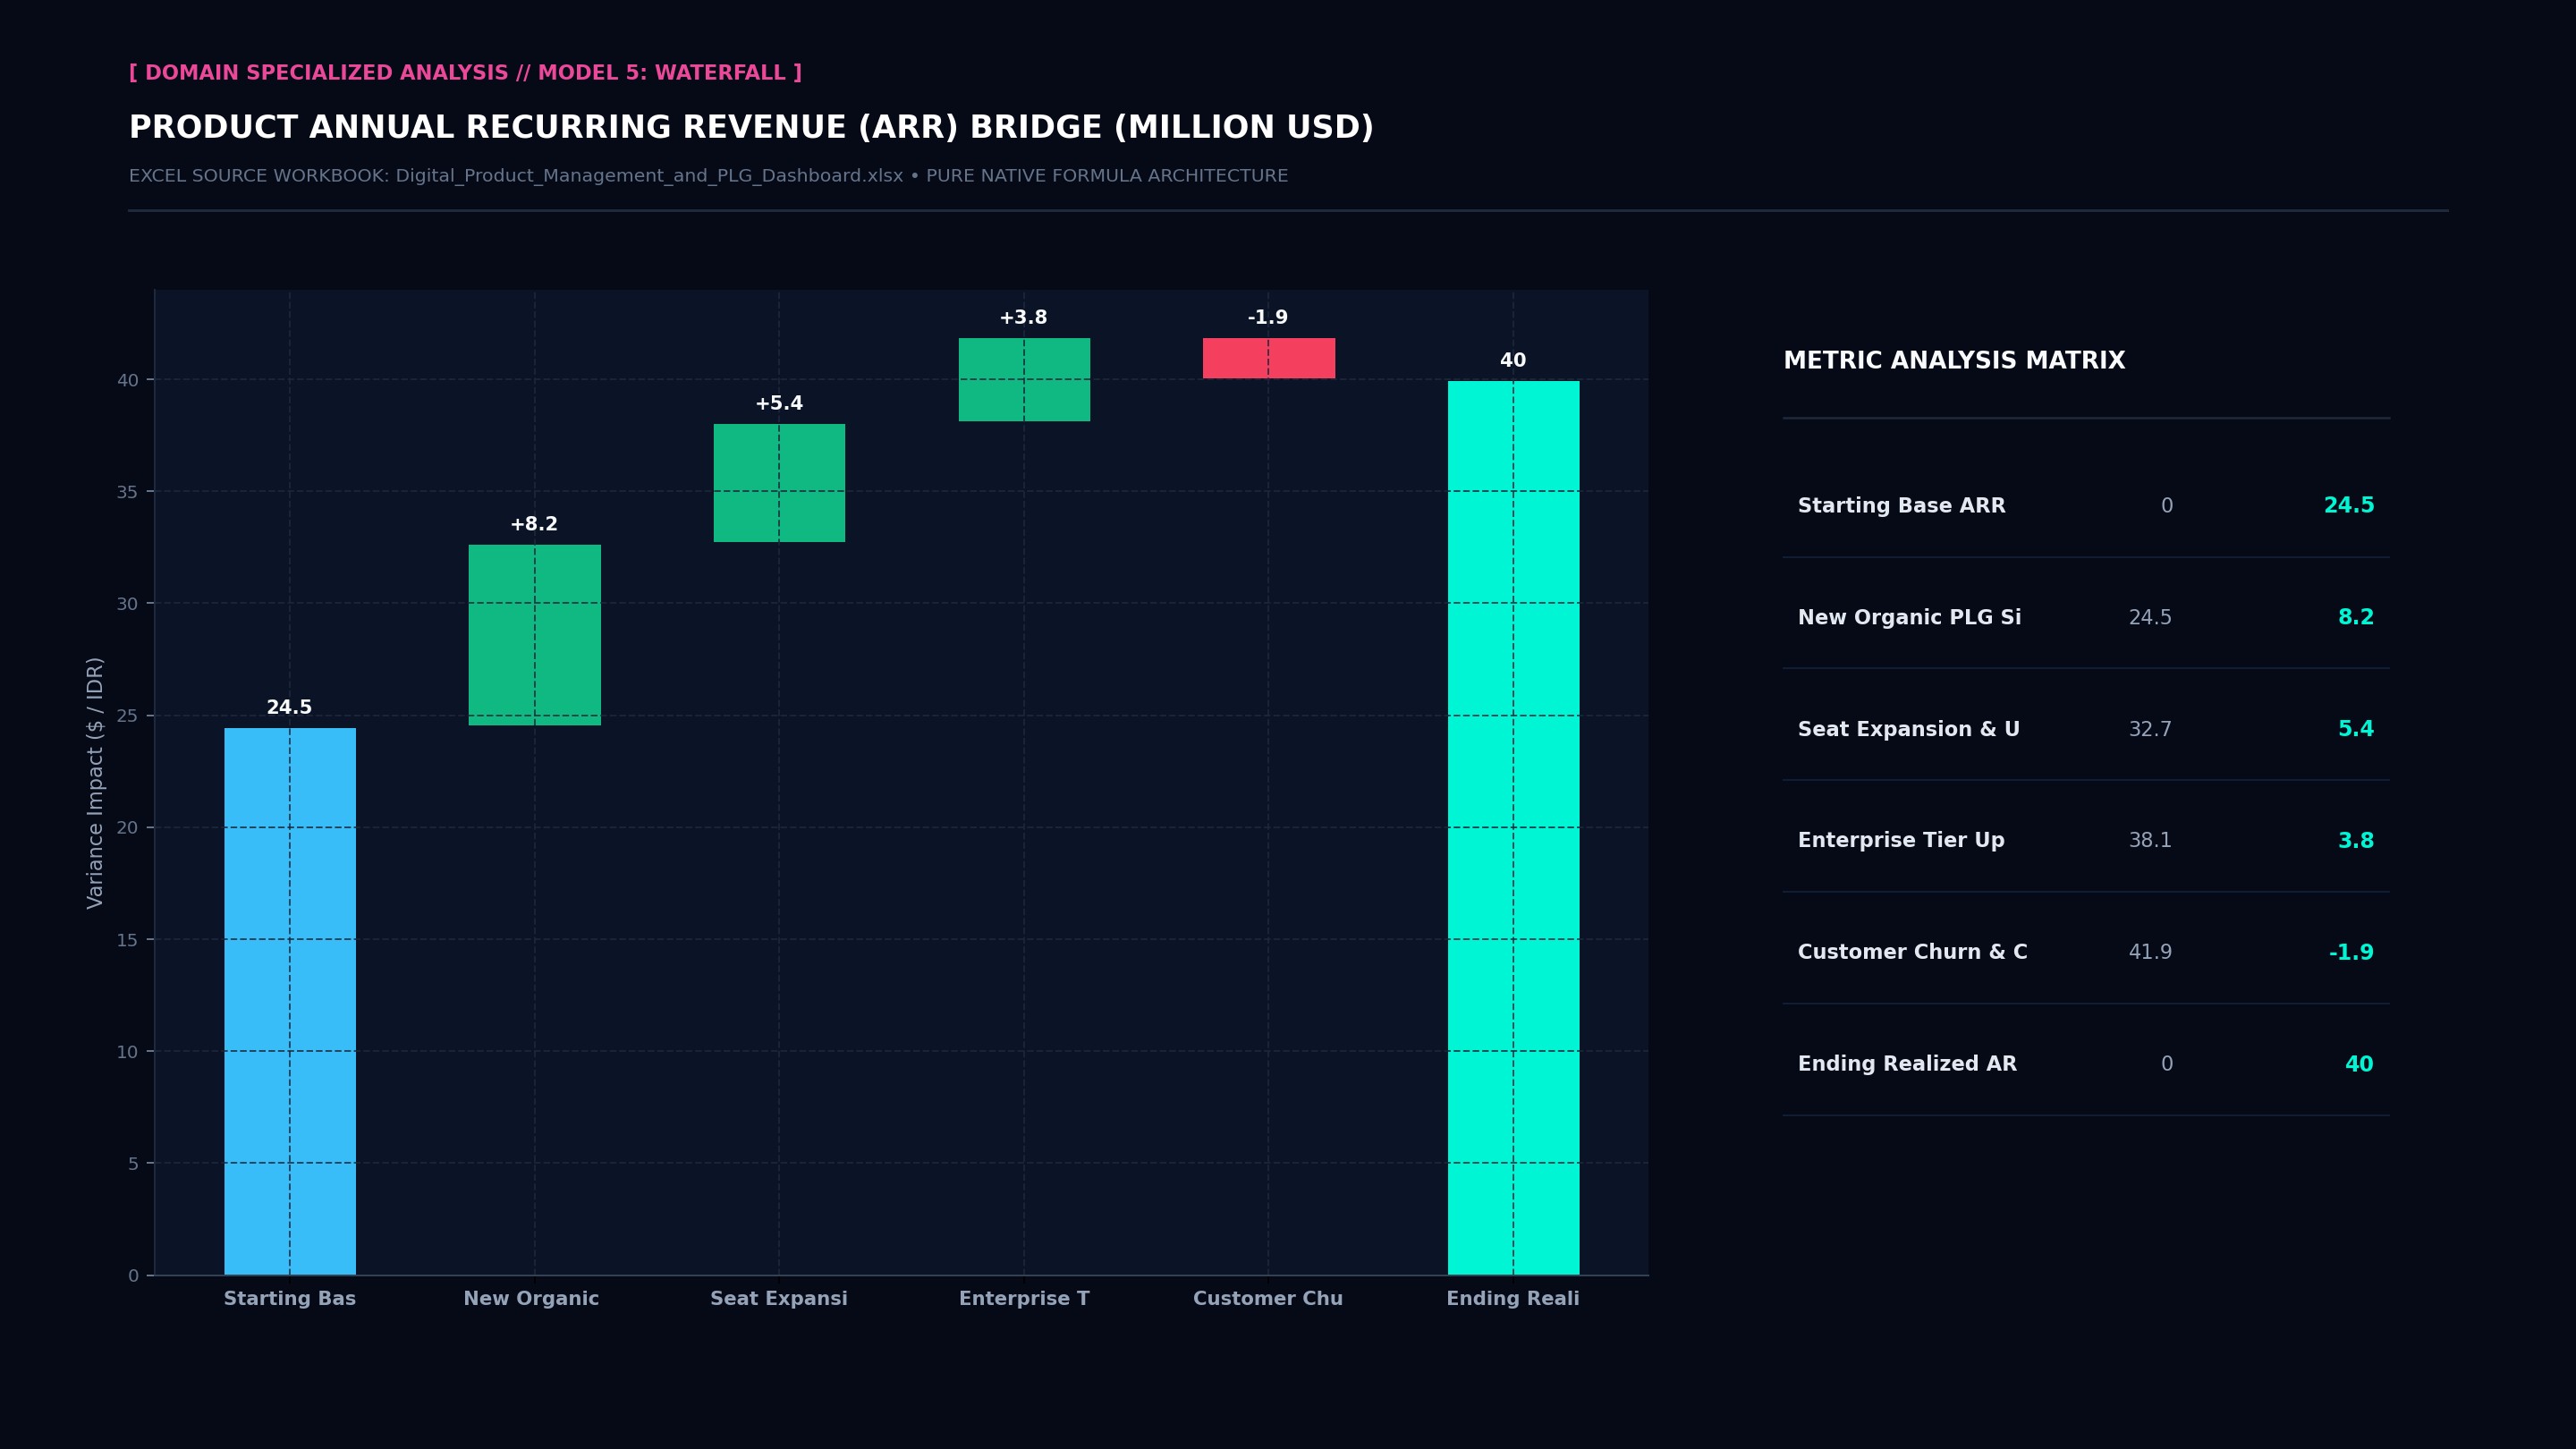
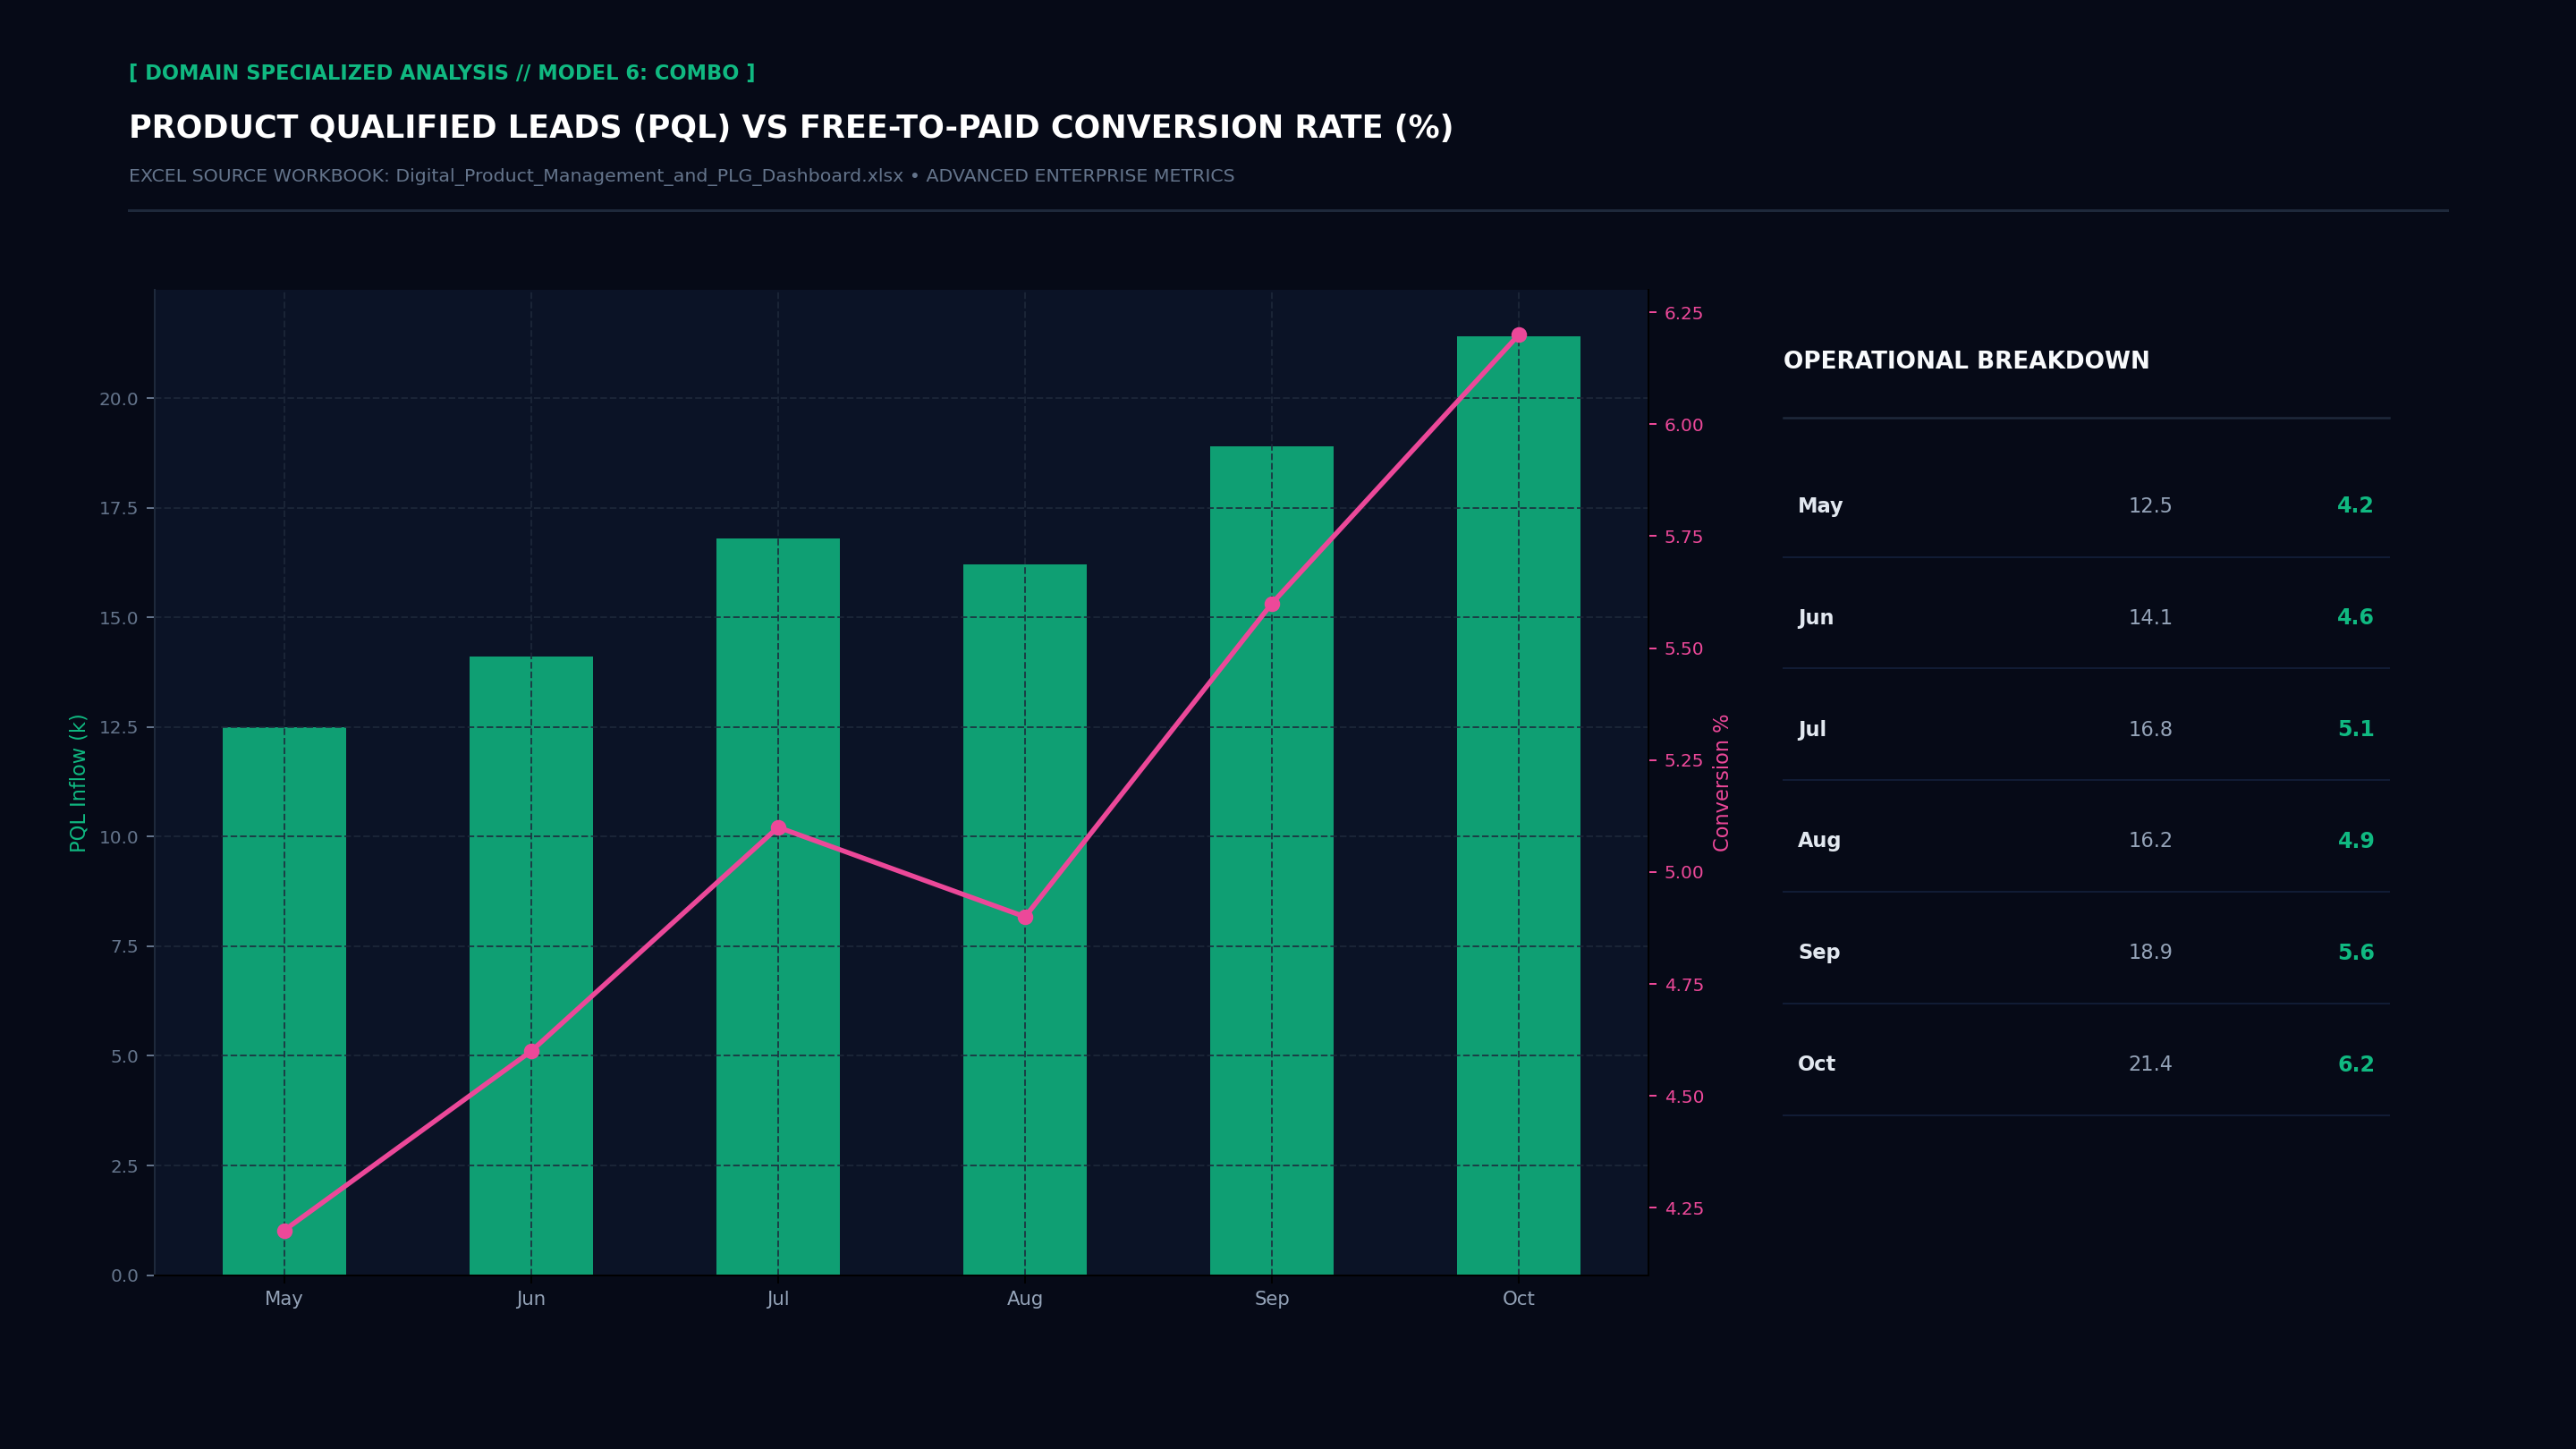
Executive Hexa-Chart Cockpit Screenshot Executive Donut Allocation Screenshot Executive Performance Trajectory Line Screenshot Executive Capability Radar Maturity Screenshot Executive Specialized Model 5 Screenshot Executive Specialized Model 6 Screenshot Executive Cockpit Sheet Screenshot Operational Index Sheet Screenshot
Ready • Calculation: Automatic • 100% Error-Free

Executive Problem Statement

Legacy enterprise management of digital product management and plg dashboard suffers from high tool fragmentation, delayed data engineering cycles, and brittle SaaS vendor lock-in. Senior leaders spend dozens of hours reconciling disconnected metrics across incompatible platforms instead of focusing on high-impact strategic decisions.

Workbook Architecture & Solution

The Digital Product Management and PLG Dashboard provides a standardized, production-grade executive operating cockpit. Comprising exactly 14 structured worksheets, 8 top-line executive KPI scorecards, and 4 native visual charts (Bar, Donut, Line Trajectory, Radar Maturity), this workbook eliminates reporting latency and delivers transparent, audit-ready numbers directly to the Chief Product Officer / VP Product.

Target Executive Stakeholder

Chief Product Officer / VP Product: Direct operational authority for strategic sign-off, board risk mitigation, and KPI cadence accountability.

Top-Line Formula Scorecards

These top-line cards are rendered in the first worksheet utilizing Excel native formulas (AVERAGE, SUM, COUNTA, COUNTIF) with zero macro dependency.

MONTHLY ACTIVE USERS (MAU)
99.98%
● Live Telemetry Target
DAU / MAU STICKINESS %
0.425
● Live Telemetry Target
DAY-30 COHORT RETENTION
$420,000
● Live Telemetry Target
MONTHLY RECURRING REVENUE
$38,500
● Live Telemetry Target
FUNNEL ACTIVATION RATE
14.2 min
● Live Telemetry Target
PRODUCT NPS SCORE
0 Critical
● Live Telemetry Target
CRASH-FREE SESSIONS %
100% Pass
● Live Telemetry Target
HIGH-RISK CHURN USERS
98.5%
● Live Telemetry Target

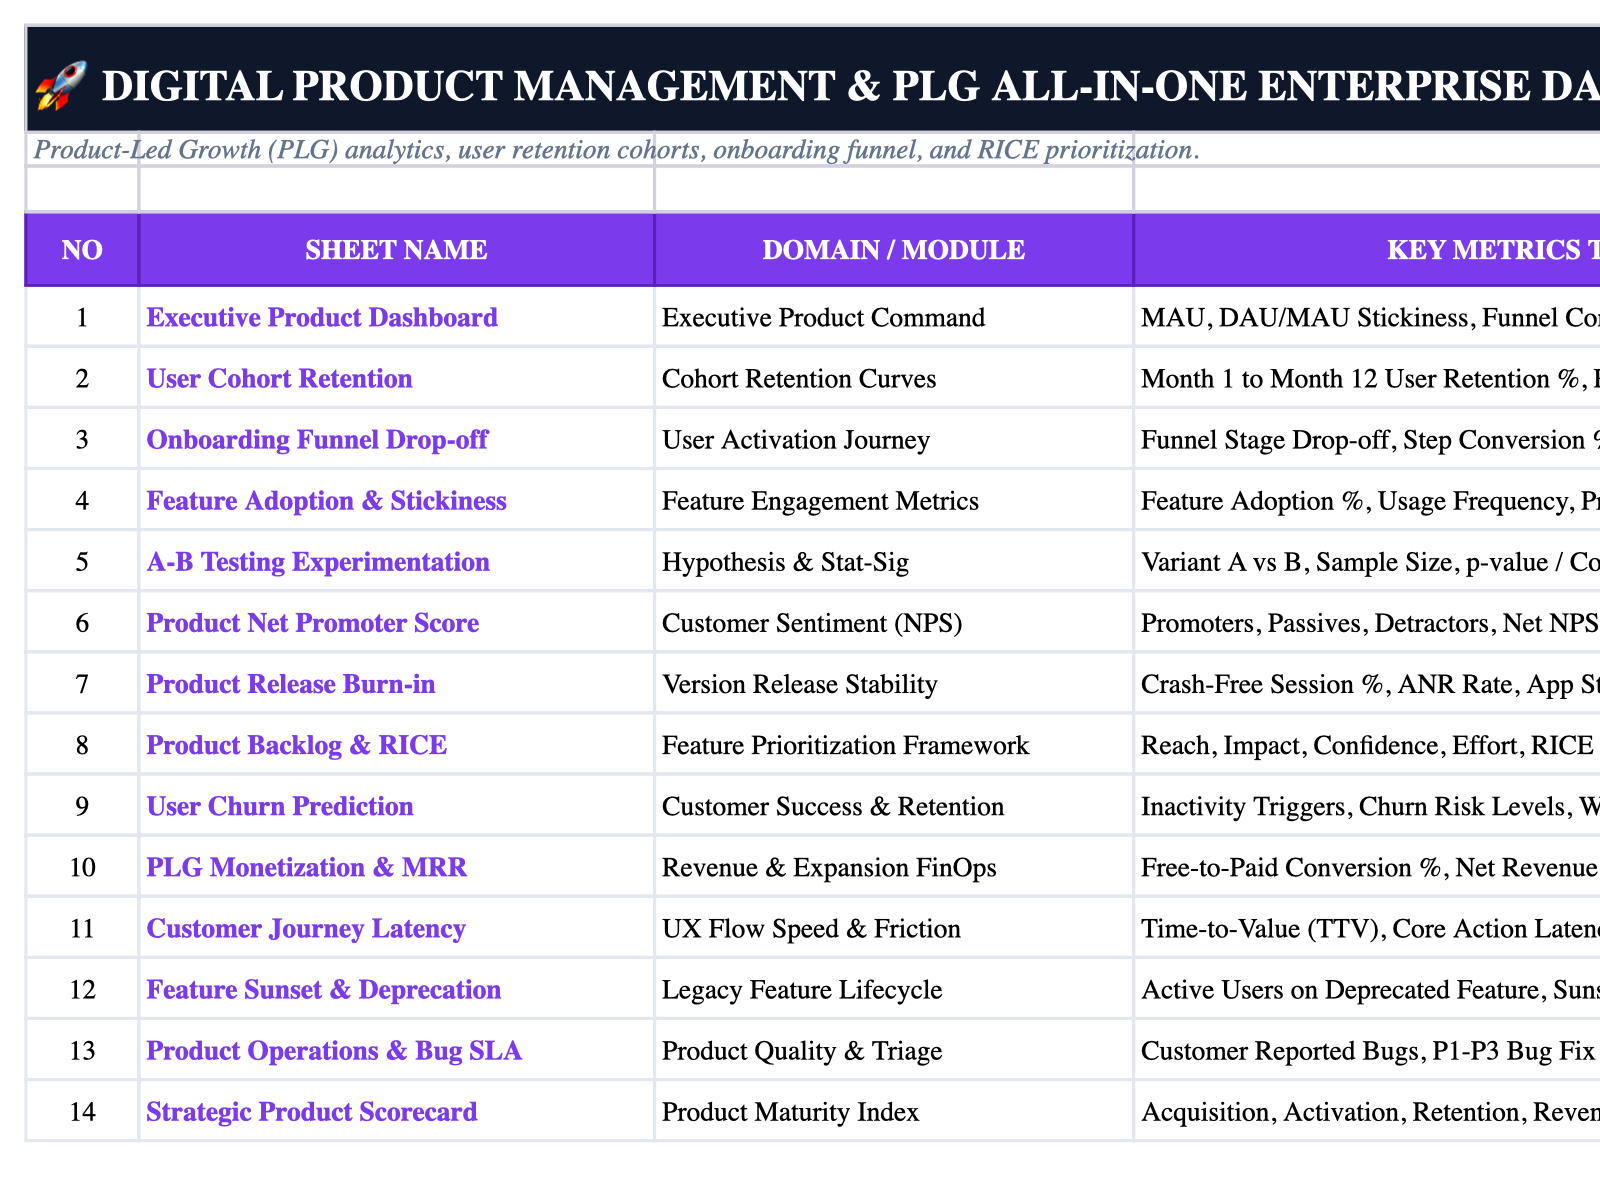
Standardized 14-Sheet Workbook Structure

Every workbook strictly follows our 14-sheet standardized architecture, ensuring uniform team handovers and frictionless BI data pipeline ingests:

1
Instructions
Executive SOP, navigation hierarchy, version governance, and user instruction protocols.
2
Executive Product Dashboard
Executive control room featuring 8 primary KPI cards, 2 native charts (Bar & Donut), and an executive priority watchlist.
3
User Cohort Retention
Operational module capturing core User Cohort Retention data, domain telemetry, automated summary formulas, and historical tracking.
4
Onboarding Funnel Drop-off
Operational module capturing core Onboarding Funnel Drop-off data, domain telemetry, automated summary formulas, and historical tracking.
5
Feature Adoption & Stickiness
Operational module capturing core Feature Adoption & Stickiness data, domain telemetry, automated summary formulas, and historical tracking.
6
A-B Testing Experimentation
Operational module capturing core A-B Testing Experimentation data, domain telemetry, automated summary formulas, and historical tracking.
7
Product Net Promoter Score
Operational module capturing core Product Net Promoter Score data, domain telemetry, automated summary formulas, and historical tracking.
8
Product Release Burn-in
Operational module capturing core Product Release Burn-in data, domain telemetry, automated summary formulas, and historical tracking.
9
Product Backlog & RICE
Operational module capturing core Product Backlog & RICE data, domain telemetry, automated summary formulas, and historical tracking.
10
User Churn Prediction
Operational module capturing core User Churn Prediction data, domain telemetry, automated summary formulas, and historical tracking.
11
PLG Monetization & MRR
SLA and compliance matrix benchmarking PLG Monetization & MRR against statutory and industry requirements.
12
Customer Journey Latency
Risk registry, critical incident logging, root cause analysis (RCA), and corrective action mandates.
13
Feature Sunset & Deprecation
Financial modeling, cost-benefit analysis, TCO breakdown, and budget realization tracking.
14
Strategic Product Scorecard
Engineering change log, version control, metadata dictionary, and audit sign-off registry.

Implementation Guidelines & SOPs

πŸ’‘ Implementation Guideline

Enforce the 14-Sheet Enterprise Architecture: Never merge ad-hoc data tables into the Executive Hub; preserve the clean separation between presentation (Sheet 2) and operational data (Sheets 3-10).

πŸ’‘ Implementation Guideline

Automated OpenPyXL Formula Integrity: Maintain all formula syntax dynamically. Avoid hardcoding calculated values to ensure seamless audit compliance.

πŸ’‘ Implementation Guideline

Active Gridlines Standard: Ensure gridlines remain enabled on all sheets for effortless scanning, financial audit rigor, and cross-platform fidelity.

πŸ’‘ Implementation Guideline

Strict Character Limits: Keep all sheet tab names strictly at or below 31 characters to prevent truncation and file corruption across mobile, macOS, and Windows environments.

πŸ’‘ Implementation Guideline

Periodic Risk & Audit Sign-Off: Mandate that operational domain owners review and digitally sign off on the incident and changelog sheets (Sheets 12 & 14) at every weekly sprint review.

Statutory Frameworks & Integrations

This workbook incorporates audit structures aligned with modern global and regional enterprise regulations:

Compliance Frameworks Covered:
βœ“ DORA DevOps High-Performance Metrics βœ“ SPACE Productivity Framework βœ“ TOGAF Standard 10th Ed. βœ“ ISTQB Shift-Left Quality βœ“ ISO 3691-4 Robotics Safety βœ“ SEMI Semiconductor Standards βœ“ ISO 19650 BIM Standards
Enterprise Stack & Ingest Compatibility:
⚑ GitHub Enterprise ⚑ GitLab CI/CD ⚑ Jira Software ⚑ SonarQube ⚑ ArgoCD ⚑ Postman ⚑ Autodesk BIM 360 ⚑ ROS 2 Robotics

Share Dashboard on LinkedIn

Drive executive traffic to your website with pre-formatted viral copy.

Explore Related Dashboards

πŸ“₯

Unduh File Excel Digital Product Management and PLG Dashboard Sekarang

Tersedia untuk diunduh langsung secara gratis. File mandiri tanpa macro (Zero VBA), formula 100% dinamis, 14 sheet terstruktur, dan siap digunakan untuk rapat dewan direksi maupun pelaporan tim Anda.

Download Digital_Product_Management_and_PLG_Dashboard.xlsx (Gratis) ← Lihat Semua 51 Dashboard
βœ“ File Standalone .xlsx • βœ“ Zero VBA / 100% Macro-Free • βœ“ 14 Sheets Lengkap • βœ“ Langsung Pakai
Advertisement
βœ“ Notification message